Lab Verified Peptide Price Trends for Researchers: Median $3–$4/mg
Availability, not list price, is the bigger risk signal right now.
TL;DR:
- Price fluctuations in metabolic peptides like Retatrutide often exceed 15-20% over 28 days due to new manufacturing capacity and supply shortages.
- Stockouts are more common and warning signals in high-demand peptides, providing early insight into upcoming price increases before list prices change.
- Comparing vendors based on independently verified purity reveals that some higher-priced listings may offer better value than cheaper, non-verified options.
- Large vial sizes and vendor tier significantly influence the per-milligram price, with newer or specialty peptides typically costing more due to lower supply and higher demand.
- Budgeting should rely on 90-day median prices and frequent re-evaluation, prioritizing verified vendors over the lowest list price to avoid failed experiments or compromised quality.
Table of Contents
- Peptide Price Trends: Market Snapshot and Key Numbers
- How Peptide Prices Are Tracked and Normalized
- Which Peptides Are Moving the Most Right Now?
- Price Ranges for Semaglutide, Tirzepatide, Retatrutide, BPC-157, and GHK-Cu
- What Stockouts and Lead Times Reveal About Peptide Costs
- How Should Researchers Budget for Peptide Purchases?
- Why Lab Verification Changes How You Read Price Spreads
- Where Peptide Pricing Is Headed Next
- Compare Verified Peptide Prices Before You Buy
- Sources
- FAQ
Peptide Price Trends: Market Snapshot and Key Numbers
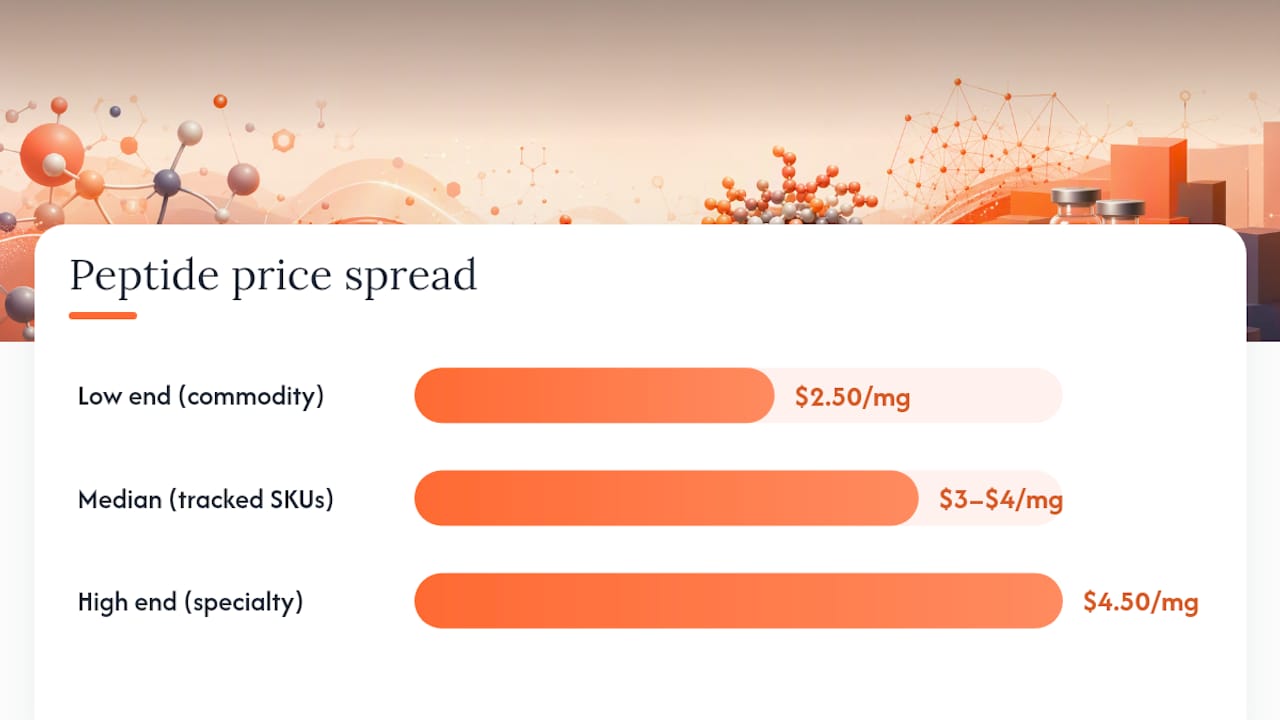
Median research peptide pricing clusters between $2.50 and $4.50 per mg for the most commonly traded compounds, though that range compresses or widens sharply depending on the peptide and the vendor tier. The tightest bands show up in mature categories with many manufacturers competing on the same synthesis routes. The widest spreads sit in newer GLP-1 analogs, where demand has outpaced the number of vendors that can reliably supply research-grade material.
A useful way to read peptide price fluctuations is across three windows: 7 day, 28 day, and 90 day. Short 7 day windows catch noise, like a single vendor running a flash sale. The 28 day window is where genuine peptide pricing strategies show up, because it smooths out one-off promotions but still reacts to real supply shifts. The 90 day window is the one that matters for budgeting a multi-month research protocol.
Market snapshot, current cycle:
- Median price across tracked SKUs: roughly $3 to $4 per mg, varying by peptide category
- 28 day movement: category medians ranging from flat to plus or minus 15 to 20% depending on the peptide
- Sample base: hundreds of price observations pulled across dozens of peptides, multiple vendors, and hundreds of individual SKUs
- High end of the range: specialty GLP-1 triple agonists and low volume custom syntheses
- Low end of the range: high volume commodity peptides like BPC-157 and GHK-Cu
Stockout signal: across the tracked cohort, a meaningful share of SKUs show at least one out-of-stock event within a 28 day window, concentrated heavily in the highest-demand metabolic peptides. That single data point often tells you more about where prices are headed than the list price itself.
How Peptide Prices Are Tracked and Normalized
Reliable peptide market analysis starts with normalization, because raw list prices are close to meaningless without it. A 5mg vial and a 10mg vial of the same peptide are not comparable until both get converted to a $/mg basis, which is standard practice in synthesis vendor pricing tables like those published by BioBasic.
- Data pulled from public vendor listings on a recurring cadence, then normalized to $/mg
- Cohort rules require a minimum number of active vendors per peptide lane before it’s included in trend reporting
- SKUs are matched by peptide, vial size, and stated purity tier before comparison
- Out-of-stock listings are flagged rather than dropped, since excluding them silently would understate true demand pressure on the median
The biggest limitation: listing price is not always transaction price, and enforcement or patent activity in one jurisdiction can make a peptide unavailable in that market while it trades freely elsewhere.
Which Peptides Are Moving the Most Right Now?
Cross-peptide trends split cleanly into two stories: metabolic peptides in flux, and everything else holding steady. Retatrutide and other newer triple or dual agonists show the largest price fluctuations in the current cycle, often moving double digits within a single 28 day window as new manufacturing capacity comes online or a popular vendor runs short.
Biggest movers by category:
- Metabolic/GLP-1 lane (Semaglutide, Tirzepatide, Retatrutide): the most volatile segment, with medians shifting as new synthesis capacity enters or exits the market
- Recovery/healing lane (BPC-157 and similar): comparatively flat, reflecting a mature, well-supplied manufacturing base
- Topical/cosmetic lane (GHK-Cu): stable pricing with occasional short-lived spikes tied to raw material sourcing
Statistic to watch: vendors report that commodity SKUs typically carry a markup of roughly 2.5x to 4x cost of goods, while specialty or newly launched SKUs often run 3x to 6x. That gap explains why a brand-new peptide can command a premium well before manufacturing costs justify it.
The likely drivers behind the split are straightforward. Metabolic peptides face genuine demand shocks from clinical interest spilling into the research market, plus periodic supply tightening as manufacturers ramp up. Recovery and topical peptides face none of that pressure, so pricing behaves the way you’d expect from a stable, competitive market. For researchers, that means budgeting conservatively for GLP-1 category work and treating older compounds as a more predictable line item.
Price Ranges for Semaglutide, Tirzepatide, Retatrutide, BPC-157, and GHK-Cu
Each of these five peptides behaves differently enough that a single blended “peptide market” number hides more than it reveals. Here’s how they break down individually.
Semaglutide trades at a wide range depending on vial size and vendor tier, with common SKUs (2mg, 5mg, 10mg vials) showing per-mg pricing that drops as vial size increases. Volatility is moderate. Stockouts happen but rarely last more than a few days given the number of vendors now carrying it.
Tirzepatide shows similar dynamics to Semaglutide but with slightly higher per-mg pricing on average, reflecting more complex synthesis. Larger vial sizes (15mg, 30mg, 60mg) are increasingly common as demand shifts toward bulk research quantities, which tends to compress per-mg cost at scale.
Retatrutide is the most volatile of the three metabolic peptides. As a newer triple agonist, it has fewer manufacturers producing it at research-grade purity, so per-mg pricing runs higher and swings more with each new entrant or stockout event.
BPC-157 is the market’s stability benchmark. A standard 5mg vial commonly runs $25 to $80 at the research-grade end, while compounded or clinical routes for the same peptide can run 200% to 800% higher. That gap alone is the clearest illustration of why channel matters as much as compound when you’re comparing peptide costs.
GHK-Cu sits at the low end of per-mg pricing among widely traded peptides, with a large vendor base keeping prices competitive. Purity claims vary more here than in other categories, which is where lab verification earns its keep.
- Purity above roughly 95% typically carries a real premium over lower-purity SKUs, a pattern consistent with published synthesis pricing tables
- Research-grade pricing and clinical/branded pricing for the same molecule are not comparable line items and shouldn’t be budgeted as if they were
What Stockouts and Lead Times Reveal About Peptide Costs
Peptide price fluctuations rarely happen in a vacuum. They usually trail a supply-side event by days or weeks, which is why availability data is often a leading indicator rather than a footnote.
- Stockout rates run highest in metabolic peptides and lowest in mature commodity peptides like BPC-157
- A SKU going from “in stock, multiple vendors” to “backordered, single vendor” is one of the clearest early warnings of a coming price increase
- Vendors sourcing from lower-cost regions sometimes offer a better list price, but longer lead times and customs risk can erase that saving if timing matters for a protocol
- A short spike tied to one vendor’s temporary outage looks very different from a sustained shift across the whole cohort. One resolves in days; the other tends to persist for months
Pro Tip: Don’t react to a single vendor’s price jump. Check whether the median across three or more vendors moved before assuming the whole market shifted.
How Should Researchers Budget for Peptide Purchases?
Turning price data into a procurement decision comes down to a few repeatable rules.
- Buy in larger, less frequent batches when a peptide’s 28 day median is trending down and stockouts are rare. Buy smaller, more frequent batches when volatility is high.
- Budget a protocol using the 90 day median $/mg rather than a single day’s quoted price, since spot prices can be noisy.
- Weight vendor selection toward those offering a certificate of analysis backed by HPLC and mass spectrometry results, even at a modest price premium.
- Recheck pricing on a set cadence, roughly every 2 to 4 weeks, and set a personal reorder threshold before a stockout forces a rushed purchase.
Pro Tip: A $30 gap on a $100 vial isn’t a reason to switch vendors if the cheaper option lacks third-party purity verification. That gap is often smaller than the cost of a failed experiment run on mislabeled material.
Why Lab Verification Changes How You Read Price Spreads
Price alone tells you almost nothing about what’s actually in the vial. Two SKUs listed at the same $/mg can differ enormously in real purity, and that’s precisely the gap Boren Health’s lab-verified vendor data is built to close, tracking pricing and purity results across more than 200 vendors with daily updates.
- Independent HPLC and mass spectrometry testing reclassifies some “cheap” listings as higher-risk once actual purity is factored in
- A vendor priced 15 to 20% above the category median with a verified 98%+ purity result often represents better value than the cheapest listing with no independent testing behind it
- Daily price tracking paired with lab data lets researchers separate genuine bargains from listings that are cheap because quality control is thin
The pattern to watch: when a listing sits well below the category median with no lab documentation, that gap is a red flag more often than a deal.
Where Peptide Pricing Is Headed Next
Expect metabolic peptides to stay the most volatile category over the next 12 months as manufacturing capacity keeps catching up to demand, while commodity peptides like BPC-157 and GHK-Cu stay range-bound. Watch new manufacturer entrants, any patent enforcement action, and clinical approval news as the three events most likely to move medians fast. Procurement teams should weight vendor verification over chasing the lowest list price.
— Ross
Compare Verified Peptide Prices Before You Buy
Chasing the lowest listed price without checking purity data is how researchers end up paying twice, once for a cheap vial and again for a failed run. A platform pairs daily price tracking with independent HPLC and mass spectrometry results across many vendors, so you can see exactly where a price sits relative to verified purity instead of guessing from a product page.
That combination matters most for the peptides covered here, where a 15% price gap between two vendors can hide a much bigger gap in actual quality. Start by checking current lab-verified pricing on Tirzepatide, Semaglutide, and Retatrutide, or browse the full vendor comparison by purity score before placing your next order.
Sources
- How much do peptides cost? — SeekPeptides
- Pricing | Peptide Synthesis — BioBasic
- Research Peptide Pricing Strategy: Markup, Bundles, Tiers — YPB
FAQ
Is the Peptide Market Growing?
Demand has expanded significantly in the metabolic and GLP-1 category, driven by clinical and research interest, which has pulled more manufacturers and vendors into that segment specifically.
What Is the Big Deal About Peptides Right Now?
The surge in interest around GLP-1 and related metabolic peptides like Semaglutide, Tirzepatide, and Retatrutide has made pricing and vendor quality far more visible and far more volatile than in older, established peptide categories.
Is There a Website That Compares Peptide Prices?
Yes. Borenhealth tracks daily pricing across more than 200 vendors alongside independent HPLC and mass spectrometry lab results, letting researchers compare cost and verified purity side by side.
How Much Should Peptides Cost Per Month?
Monthly costs vary widely by channel: research-grade suppliers, compounding pharmacies, and branded clinical products all price the same molecule differently, sometimes by several hundred percent, so the right comparison depends on which channel and protocol size you’re budgeting for.