98% HPLC Purity Can Be 75% Peptide, HPLC Testing for Researchers
A single HPLC run tells you the chromatographic purity of a peptide among UV-detectable species, typically measured at 214 to 220 nm. It does not confirm molecular mass, sequence identity, or non-UV contaminants like water and residual salts. Treat any purity percentage as incomplete until it is paired with LC-MS confirmation and a net peptide content assay, and always request the raw chromatogram alongside the method details.
TL;DR:
- HPLC purity percentages are incomplete without LC-MS confirmation and the raw chromatogram, as they do not indicate molecular weight or non-UV contaminants.
- Method details such as column type, mobile phase modifiers, and retention time reproducibility are essential for evaluating the reliability of an HPLC purity test.
- Peak shape, retention time, and baseline stability in the chromatogram provide critical diagnostic information about impurity levels and system performance.
- HPLC measures only UV-absorbing species, so orthogonal tests like LC-MS, amino acid analysis, and moisture quantification are vital for comprehensive peptide characterization.
- Vendors should provide full method details, raw data, and orthogonal test results on the Certificate of Analysis to ensure quality and reproducibility.
Table of Contents
- Why HPLC Is the Standard for Peptide Purity Testing
- What Column and Gradient Choices Actually Matter?
- How Do You Interpret an HPLC Chromatogram?
- HPLC Purity vs. Net Peptide Content: What’s the Difference?
- Which Orthogonal Tests Fill HPLC’s Blind Spots?
- What Should Be on a Peptide Certificate of Analysis?
- What Should You Request Before Running an Experiment?
- How Boren Health’s Independent Testing Reduces Research Risk
- The Responsible Way to Rely on HPLC Data
- Get Your Peptide Sample Independently Verified
- Sources
Why HPLC Is the Standard for Peptide Purity Testing
Reversed-phase HPLC (RP-HPLC) separates peptides by hydrophobicity as they interact with a C18 or C8 stationary phase. A gradient of increasing organic solvent, usually acetonitrile against an aqueous buffer, pushes peptides off the column in order of increasing hydrophobic character. Detection at 214 to 220 nm captures the peptide backbone’s amide bond absorbance, which is why nearly every peptide certificate of analysis leans on this exact wavelength range.
RP-HPLC dominates peptide QC because it is fast, reproducible, and scales cleanly from analytical to preparative runs. But it isn’t the only tool worth knowing:
- Ion-exchange chromatography (IEX) separates by net charge, useful for resolving deamidated or charge-variant impurities that RP-HPLC might miss.
- Size-exclusion chromatography (SEC) flags aggregates and dimers, an increasingly relevant check for longer therapeutic peptides.
- HILIC and CEX serve as orthogonal modes when a peptide’s hydrophobicity profile makes RP-HPLC separation ambiguous.
The three major HPLC modes for peptide work are SEC, IEX, and RP-HPLC, with RP-HPLC generally winning on speed and resolution. A COA worth trusting names the column, the detector, and the acceptance criteria used, not just a bare number.
What Column and Gradient Choices Actually Matter?
Method details separate a defensible chromatogram from a decorative one. If a vendor won’t share these parameters, that alone is worth flagging.
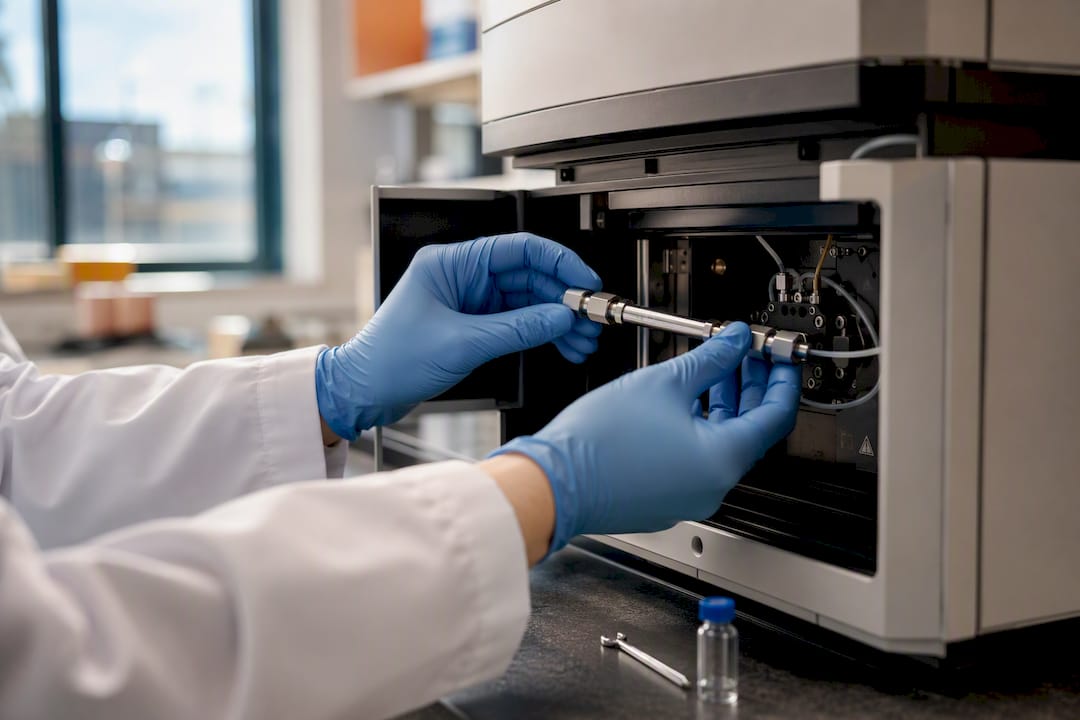
Columns and temperature. Most peptide labs run columns of typical laboratory-scale internal diameters with mid-range particle sizes, often held at moderate temperatures for retention time stability. Sub 2 micron core shell particles show up in higher resolution methods, especially for complex or aggregation prone sequences.
Mobile phase modifiers. This is where a lot of vendors cut corners. Trifluoroacetic acid (TFA) at standard low levels gives sharp, symmetric UV peaks, but it suppresses electrospray ionization and reduces MS sensitivity. Formic acid is the standard swap when LC-MS confirmation is the goal, though it often produces broader UV peaks. Difluoroacetic acid (DFA) splits the difference, offering reasonable peak shape with better MS compatibility than TFA. If a COA reports both a clean UV purity number and an intact mass confirmation from the same injection, DFA or formic acid was almost certainly the modifier.
Sample prep and system suitability. Follow this sequence when evaluating or running a method:
- Dissolve the peptide at a concentration low enough to avoid column overload, typically 0.5 to 2 mg/mL depending on solubility and detector range.
- Filter through a 0.22 micron membrane to remove particulates that cause pressure spikes and ghost peaks.
- Run a blank injection first to confirm no carryover from prior samples.
- Run a reference standard to confirm the system meets suitability criteria before trusting the sample data.
- Confirm tailing factor (Tf) sits close to 1.0, theoretical plates (N) are adequate for the column length, and resolution (Rs) between adjacent peaks exceeds 1.5.
Pro Tip: Ask for retention time repeatability across at least three injections. A method that can’t reproduce retention time within a few seconds run to run isn’t stable enough to trust for purity claims.
How Do You Interpret an HPLC Chromatogram?
The x-axis is retention time, the y-axis is detector response, usually UV absorbance in milli-absorbance units. Retention time identifies which peak is your peptide (by comparison to a standard); peak area, not peak height, is what gets integrated for purity calculations. The main peak’s identity is confirmed by retention time while quantitation depends on peak area, so a chromatogram with no labeled retention times is nearly useless for verification.
Peak shape tells its own story. A tailing factor drifting well above 1.0 usually points to silanol interactions on an aging or poorly deactivated column. Fronting suggests overload, meaning too much sample was injected. Shoulders or unresolved bumps near the main peak often mean a co-eluting impurity is hiding under what looks like a clean, symmetric result.
- Solvent front peaks and injection artifacts near time zero should never be counted in the purity calculation.
- Saturated (flat-topped) peaks distort area integration and understate impurity levels.
- Baseline drift across the run, especially during gradient steps, can inflate or shrink reported peak areas depending on where the software draws its baseline.
A tailing factor near 1.0 signals a clean Gaussian peak. Meaningful deviation from that number is a real diagnostic flag, not a cosmetic detail, because it often means a co-eluting impurity is masked under the main peak rather than genuinely absent.
Detector wavelength choice and blank subtraction both shift the reported number too. A method run at 220 nm instead of 214 nm can report a slightly different purity for the same sample, since different residues and impurities absorb differently at each wavelength.
HPLC Purity vs. Net Peptide Content: What’s the Difference?
Chromatographic purity and net peptide content answer two different questions, and vendors that report only one are giving you half the picture.
HPLC purity tells you what fraction of the UV-absorbing material under the main peak is your peptide relative to other UV-visible species in that same run. It says nothing about water content, residual trifluoroacetate salts, or counterions bound to the peptide, all of which add weight without adding active peptide. A sample can show 98% HPLC purity and still be only 75% peptide by mass once moisture and salt are accounted for.
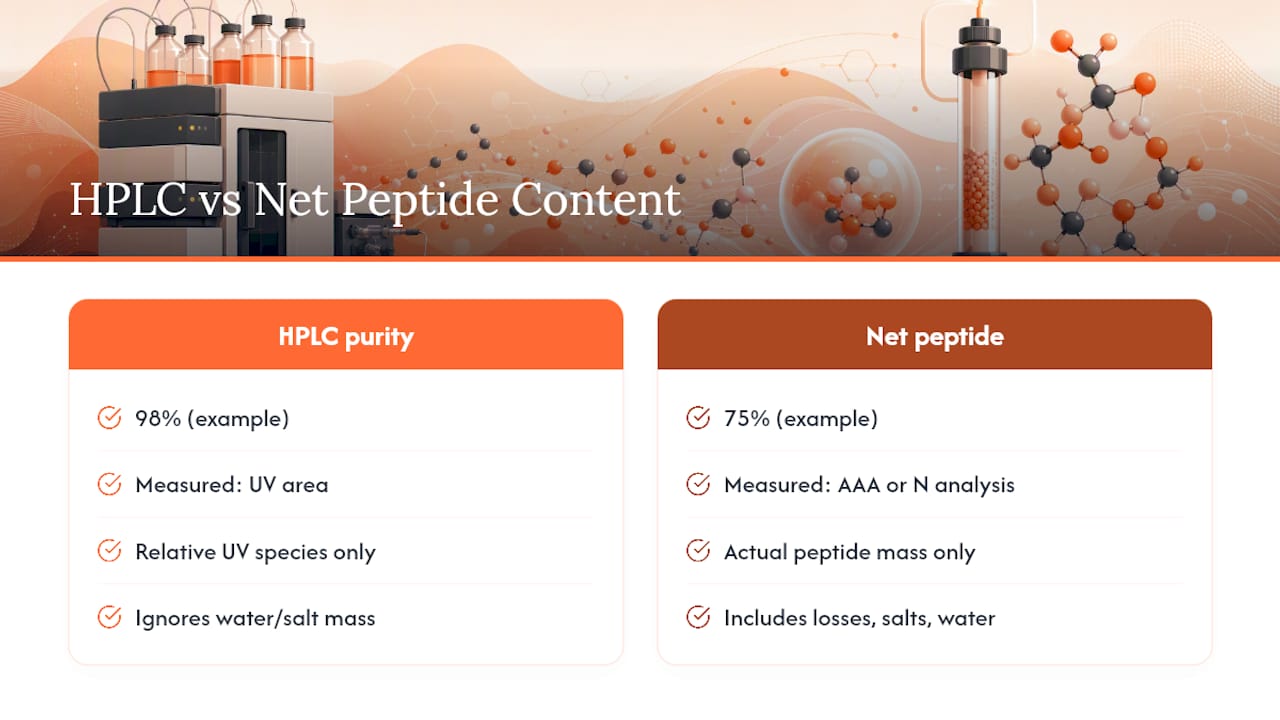
Net peptide content, determined by amino acid analysis (AAA) or elemental/nitrogen analysis, measures the actual peptide mass in a given weight of powder. The distinction matters enormously for anyone doing quantitative dosing, since HPLC purity and net peptide content are calculated from entirely different measurements, and confusing the two leads to systematic underdosing or overdosing in experimental work.
Which Orthogonal Tests Fill HPLC’s Blind Spots?
UV-HPLC only sees what absorbs at your chosen wavelength. Everything else, water, salts, non-chromophoric excipients, passes through invisibly. That’s why regulatory-grade characterization never relies on HPLC alone.
- LC-MS intact mass confirms the molecule’s actual mass, catching oxidation, deamidation, or truncated sequences that look identical to the correct peptide on a UV trace.
- MS/MS (tandem MS) fragments the peptide to confirm sequence and pinpoint exactly where a mass shift occurred.
- Amino acid analysis or elemental analysis delivers net peptide content, the number that matters for dosing accuracy.
- Karl Fischer titration quantifies residual moisture, a major contributor to the gap between HPLC purity and usable peptide mass.
- ELSD or CAD detection catches non-UV-absorbing impurities that a standard UV detector simply cannot see.
- Endotoxin and sterility testing become necessary whenever a peptide is destined for cell culture or in vivo work, regardless of how clean its HPLC trace looks.
Regulatory submissions integrate RP-HPLC with LC-MS, HRMS, and orthogonal methods precisely because no single technique covers identity, content, and safety at once.
What Should Be on a Peptide Certificate of Analysis?
A COA that only shows a purity percentage and a lot number is a marketing document, not analytical evidence. Here’s the minimum a defensible COA should include:
- Full sequence and molecular formula, so identity can be independently checked.
- Method details: column type and dimensions, particle size, mobile phase, gradient, and detection wavelength.
- Raw chromatogram image, not just a summary table, so peak shape and baseline can be assessed directly.
- LC-MS intact mass data confirming the peptide matches its expected molecular weight.
- Net peptide content, from AAA or elemental analysis, separate from HPLC purity.
- Water content by Karl Fischer titration.
- Lot number and acceptance criteria used to pass or fail that batch.
Watch for these red flags: a missing or low-resolution chromatogram image, a main peak that appears cut off at the top of the scale, purity reported with no corresponding content data, or any COA that omits method parameters entirely. Reputable suppliers routinely include chromatogram images and MS confirmation on their documentation, so their absence is a legitimate reason to request more before you buy or use a batch.
If a vendor can’t or won’t produce the raw chromatogram file, raw MS spectra, or a repeat run on a different column chemistry, treat that as a data gap, not a formality.
What Should You Request Before Running an Experiment?
Before committing budget or bench time to a peptide, put together a short, specific request rather than accepting whatever documentation a vendor happens to send by default.
- Minimum baseline: an RP-HPLC chromatogram at 214 nm, plus LC-MS intact mass confirmation, plus the full method (column, gradient, mobile phase).
- For dosing accuracy: net peptide content via AAA or nitrogen analysis, and Karl Fischer moisture data.
- For impurity identification: MS/MS data and, where feasible, a second run on an alternate column chemistry to rule out co-elution.
- For non-UV contaminants: ELSD or CAD detection results alongside the standard UV trace.
Pro Tip: Always ask for the batch-specific COA, not a generic template certificate. A generic COA tells you what the method can theoretically detect. A batch-specific one tells you what’s actually in the vial on your bench.
Raw data files, not summary PDFs, let you or a colleague re-integrate a chromatogram independently if something looks off.
How Boren Health’s Independent Testing Reduces Research Risk
Chasing down method details, LC-MS confirmation, and net peptide content from dozens of vendors independently is slow, and it’s exactly the gap Borenhealth was built to close. Borenhealth runs independent HPLC and LC-MS testing across more than 200 vendors and compiles the results into one comparison platform, so raw chromatograms and content data sit next to price and purity instead of scattered across vendor PDFs.
- Independent testing resolves the missing-COA problem directly: if a vendor’s own documentation lacks a chromatogram image or MS confirmation, Borenhealth’s lab data fills that gap with third-party results.
- Researchers can use purity and net content figures across vendors to shortlist candidates before spending on a full order.
- When a specific batch or vendor’s data still looks thin, Borenhealth’s reports point to exactly which follow-up test, MS/MS, AAA, or a repeat HPLC run, is worth requesting directly from the supplier.
Cross-referencing a vendor’s self-reported COA against independent lab results turns a one-sided claim into a checkable fact.
The Responsible Way to Rely on HPLC Data
HPLC is the right first test for peptide purity, but treating a single purity percentage as the whole story is where most quality problems in peptide research actually originate. Orthogonal confirmation, LC-MS for identity, AAA for content, Karl Fischer for moisture, isn’t a nice-to-have add-on. It’s the difference between a defensible result and a number you’re hoping is right.
The bigger issue in this field isn’t bad chromatography. It’s data that’s never shared at all. Vendors that publish raw chromatogram files, method parameters, and mass spec traces alongside their purity claims are giving researchers something they can actually verify, and that transparency should be the baseline expectation, not a premium feature reserved for regulatory submissions.
Reproducibility in peptide research depends on scientists demanding that same transparency from every supplier they use, every time, not just when the stakes are obviously high.
— Ross
Get Your Peptide Sample Independently Verified
Reading a vendor’s COA critically only gets you so far when the underlying data is thin or missing. Borenhealth exists for exactly that gap: independent HPLC and LC-MS testing on real batches, not vendor self-reports, with net peptide content and raw chromatogram data included rather than summarized away.
If you’re sourcing a peptide and want lab-verified purity and content data before you commit budget, submit your sample for independent testing and get a batch-specific COA built the way this article describes one should look. Already have a vendor in mind? Check their existing lab results and comparative purity scores before you order, so the decision rests on verified data instead of a vendor’s own claims.
Sources
- HPLC Analysis and Purification of Peptides - PMC
- Identifying & Quantitating Compounds Using HPLC - Waters