Labs: Fix LC First in Peptide Mass Spectrometry with Nanoflow, 1% FDR
Peptide mass spectrometry identifies and quantifies peptides by measuring mass-to-charge ratios in MS1, then sequencing them through MS2 fragmentation. The output is a peptide ID, a localized PTM, a sequence tag, or a quantitative value tied to abundance. Every workflow follows the same skeleton: digest or extract, separate by liquid chromatography, ionize, measure precursor mass, fragment, and interpret.
TL;DR:
- Peptide mass spectrometry workflow relies heavily on liquid chromatography to improve sensitivity and reduce co-eluting species before ionization.
- Choosing between data-dependent (DDA) and data-independent (DIA) acquisition affects reproducibility and coverage, with DIA offering more consistent quantification across runs.
- Proper sample preparation, including cleanup and digestion efficiency checks, is essential to prevent false negatives and ensure high-quality data.
- Fragmentation methods like CID/HCD or ETD should be selected based on whether confident peptide sequencing or post-translational modification mapping is the goal.
- Verifying sample purity and starting material quality before analysis prevents costly data misinterpretation and ensures reliable results.
Table of Contents
- What Is Peptide Mass Spectrometry and How Does the Workflow Run?
- Sample Preparation and Digestion Strategy
- Choosing Ionization Methods and Mass Analyzers
- How Fragmentation Reveals Peptide Sequence
- DDA vs. DIA: Picking an Acquisition Strategy
- Database Search, PSM Scoring, and De Novo Sequencing Tools
- Quantification: Label-Free, Isotopic Labels, and Isobaric Tags
- Chromatography Hygiene, QC, and Parameter Tuning That Actually Fix Problems
- The Real Bottleneck in Peptide Mass Spectrometry
- Verify Your Peptide Samples Before You Run Them
- Sources
What Is Peptide Mass Spectrometry and How Does the Workflow Run?
The instrument stack has three jobs, and researchers who skip understanding any one of them tend to misdiagnose bad data. The ion source turns peptides in solution into gas-phase ions. The mass analyzer separates those ions by mass-to-charge ratio. The detector counts them and reports intensity. That’s the whole machine, conceptually. Everything else is optimization.
Liquid chromatography sits upstream of all three, and it matters more than most people give it credit for. A reversed-phase column separates peptides by hydrophobicity before they ever reach the ion source, which reduces the number of co-eluting species competing for ionization at any given moment. Nanoflow LC, running at a few hundred nanoliters per minute instead of the microliter-per-minute flows common in older HPLC setups, concentrates the sample into a smaller electrospray plume. That concentration effect is a major reason nanoflow systems report better sensitivity on limited sample amounts.
The MS1 versus MS2 distinction is the conceptual hinge of the entire field. MS1 measures the intact peptide ion, the precursor, and gives you its mass and charge state. That’s useful for matching against a database, but it tells you nothing about sequence. MS2, or tandem mass spectrometry, isolates that precursor and fragments it along the peptide backbone. The resulting fragment ions, read as a ladder, reveal the amino acid sequence one residue at a time.
Where this fits in the bigger picture:
- Bottom-up proteomics digests proteins into peptides first, then infers protein identity and abundance from those peptide measurements.
- Peptidomics skips digestion and measures naturally occurring peptides, like hormones or neuropeptides, directly from tissue or fluid.
- Top-down proteomics analyzes intact proteins without digestion at all, trading sequence coverage for an intact mass and modification pattern.
Peptide MS specifically refers to the first two. Understanding which one you’re running before you set up your method saves a lot of wasted instrument time.
Sample Preparation and Digestion Strategy
Most peptide MS work starts with a decision: digest the protein, or don’t. Bottom-up workflows digest because peptides fragment more predictably and reconstruct more easily during MS/MS than an intact protein would. Trypsin remains the primary protease for this step because it cuts specifically after lysine and arginine residues, producing peptides in the ideal 700 to 3,000 Da mass range for most instruments, with a basic residue at the C-terminus that improves fragmentation behavior under CID and HCD.
Peptidomics inverts that logic entirely. If you’re measuring endogenous peptides, hormones, or signaling molecules that already exist at their biologically active length, digesting them destroys the very thing you’re trying to measure. Peptidomics workflows extract and measure peptides directly, and modern instruments are sensitive enough to distinguish closely related forms, like amidated versus non-amidated peptides differing by a small but resolvable mass difference, without any enzymatic step at all.
A standard bottom-up digestion protocol runs through predictable stages:
- Denature and reduce the protein with heat and a reducing agent to unfold the structure and break disulfide bonds.
- Alkylate cysteine residues to prevent disulfide reformation during digestion.
- Add trypsin at roughly a 1:20 to 1:50 enzyme-to-substrate ratio and incubate, typically overnight at 37°C.
- Quench the reaction and desalt the resulting peptides before injection.
Cleanup is where a lot of otherwise-solid experiments quietly fail. Detergents used for cell lysis, particularly SDS, suppress electrospray ionization efficiency badly, so any lysis buffer with detergent needs a cleanup step, usually solid-phase extraction or a filter-based digestion method, before the sample ever sees the ESI source. Residual salts do the same thing at lower concentrations. Desalting with a C18 spin column or StageTip is the cheapest insurance you can buy against a flat, noisy spectrum.
Quality control checkpoints belong at three points: after digestion (check completeness with a quick LC-MS run before committing the whole batch), after cleanup (confirm no visible precipitate or cloudiness), and immediately before the full analytical run (a short blank injection catches carryover from a previous sample).
Pro Tip: Run a digestion efficiency check on a single reference protein, like BSA, every time you change enzyme lots. Trypsin activity varies more between batches than most labs assume, and a sluggish lot will quietly lower your peptide yield across an entire study.
Choosing Ionization Methods and Mass Analyzers
Electrospray ionization and MALDI solve the same problem, getting a peptide into the gas phase as a charged ion, but they fit different experimental goals. ESI works by applying a high voltage, typically 2 to 4 kilovolts at the emitter tip, which pulls charged droplets from the liquid sample as it exits a fine capillary. Solvent evaporates from the shrinking droplets until you’re left with bare, multiply charged peptide ions. Because ESI ionizes directly from a liquid stream, it couples naturally to LC, which is why nearly every modern peptide identification workflow runs LC-MS with an ESI source.
MALDI works differently and fits a different niche. The peptide sample is mixed with a light-absorbing matrix, commonly alpha-cyano-4-hydroxycinnamic acid for peptides, then hit with a laser pulse that co-desorbs matrix and analyte into the gas phase. MALDI produces mostly singly charged ions and skips the liquid chromatography step entirely, which makes it fast for high-throughput screening or imaging applications, but it generally can’t match ESI-LC-MS for depth on complex mixtures.
Analyzer choice is where experiment design gets concrete:
- Orbitrap analyzers trap ions in an electrostatic field and measure their oscillation frequency, delivering high resolution and mass accuracy that’s excellent for confident identification and for resolving closely spaced isotope peaks.
- Time-of-flight (TOF) analyzers measure how long ions take to travel a fixed distance, offering fast scan speeds that pair well with DIA methods and high-throughput pipelines.
- Quadrupole analyzers filter ions by m/z using oscillating electric fields and are commonly used as a precursor selection stage ahead of another analyzer, as in a triple quadrupole or Q Exactive design.
- Ion trap analyzers confine ions in a three-dimensional field, offer fast, sensitive scanning, and are often the workhorse for MS2 fragmentation even on hybrid instruments built around a different primary analyzer.
If your goal is deep, confident identification across a complex proteome, an Orbitrap-based system earns its cost. If throughput and speed matter more, a TOF-based instrument or an ion trap running fast duty cycles will get you through more samples per day, usually at some cost to mass accuracy.
How Fragmentation Reveals Peptide Sequence
Fragmenting a peptide precursor breaks bonds along the backbone, and where those bonds break determines what kind of ion you see and what it tells you. The two dominant fragmentation chemistries, collision-induced dissociation (CID) and higher-energy collisional dissociation (HCD), break the amide bond between residues, generating b-ions (containing the N-terminal fragment) and y-ions (containing the C-terminal fragment). Electron transfer dissociation (ETD) breaks a different bond, the N-Cα bond, generating c-ions and z-ions instead.
That chemistry difference isn’t academic. It changes which experiments work.
- CID and HCD are fast, efficient, and the default choice for most standard peptide identification runs on ion trap and Orbitrap instruments.
- ETD preserves labile post-translational modifications, like phosphorylation or glycosylation, that CID/HCD tends to strip off before you can localize them, making it the better choice for PTM mapping.
- EThcD, a hybrid combining ETD with a supplemental HCD activation step, often outperforms either method alone on larger or higher-charge-state peptides, generating both ion series in a single scan.
Reading a spectrum manually comes down to building a ladder. If you line up the b-ion series (or the y-ion series) by mass, the difference between consecutive peaks equals the mass of a single amino acid residue. String enough of those mass differences together and you’ve reconstructed a sequence tag, sometimes the full peptide sequence, without ever touching a database. This is exactly the manual skill that the Hunt Lab’s fragment calculator and de novo sequencing guide was built to teach, and it remains genuinely useful when an automated search comes back empty and you need to know whether that’s because the peptide truly isn’t in any database or because something went wrong with the search parameters.
A few pitfalls trip up even experienced analysts:
- Isotopologue misselection: picking the wrong isotope peak as the monoisotopic precursor mass throws off every downstream calculation by roughly one Dalton per missed isotope.
- Missing monoisotopic peaks: at low abundance, the true monoisotopic peak can fall below the noise floor, and software will sometimes default to a heavier isotope incorrectly.
- Charge state misassignment: a doubly charged 2+ ion and a singly charged 1+ ion at half the mass can look deceptively similar on a low-resolution instrument.
Pro Tip: When a database search fails on a spectrum you’re confident is real, manually annotate the top ten most intense peaks by hand before reaching for de novo software. Half the time the issue is a modification the search didn’t include as a variable, not a genuinely novel peptide.
DDA vs. DIA: Picking an Acquisition Strategy
Data-dependent acquisition (DDA) and data-independent acquisition (DIA) answer the same question, which peptides are in this sample, with opposite philosophies. DDA selects individual precursor ions for fragmentation based on real-time rules, typically the most intense ions detected in the preceding MS1 scan. It’s intuitive and it’s been the default for two decades, but it’s inherently stochastic. Run the same sample twice and DDA won’t select the exact same precursors both times, which produces the missing-value problem that plagues label-free quantification studies across replicates.
DIA takes the opposite approach: fragment everything in a wide m/z window, systematically, regardless of intensity. That produces comprehensive but highly convoluted MS2 spectra, since multiple precursors get fragmented together in the same window. Making sense of that convolution requires either a spectral library or sophisticated deconvolution algorithms that reconstruct which fragment came from which precursor.
That library dependence is the real trade-off to plan around. NIST’s peptide mass spectral libraries and community-built libraries give DIA workflows a reference point for matching fragment patterns back to specific peptides, but a library built on one instrument type or sample matrix won’t transfer perfectly to another. Library-free DIA analysis exists and has improved substantially, but it generally asks more of your computational pipeline and your patience.
Practical guidance for choosing:
- Use DDA for discovery work, unknown samples, or anything where you genuinely don’t know what to expect and want the instrument to prioritize the most abundant signals automatically.
- Use DIA for large-scale quantitative studies, especially longitudinal or multi-cohort studies, where reproducibility across dozens or hundreds of runs matters more than exhaustive discovery on any single run.
- Match your isolation window width to your analyzer’s resolving power; a wider window on a lower-resolution instrument multiplies the deconvolution problem rather than solving it.
Database Search, PSM Scoring, and De Novo Sequencing Tools
Database searching remains the default identification strategy, and it works by comparing observed MS2 spectra against theoretical fragment patterns generated from a protein sequence database. Every match gets scored, and that score, the peptide-spectrum match or PSM score, is what tells you whether to trust the identification. A high score means the observed fragment pattern closely matches theoretical predictions for that peptide sequence. A borderline score means proceed with caution and check the raw spectrum yourself.
False discovery rate (FDR) control is non-negotiable in any serious study. The standard approach searches a decoy database, usually a reversed or randomized version of the real one, alongside the target database, then calculates FDR from the ratio of decoy hits to target hits at a given score threshold. Most published proteomics work targets a 1% FDR at the peptide level, and skipping this step is one of the fastest ways to publish identifications that don’t replicate.
Search platforms like ProteoSAFe, which hosts tools including InsPecT, support both restrictive searches (matching against expected modifications and cleavage rules) and unrestricted or blind searches that look for unexpected mass shifts, useful when you suspect a modification you haven’t specified. These platforms are also configurable by instrument type, letting you set tighter or looser mass tolerances depending on whether your data came off a high-resolution Orbitrap or an older ion trap.
De novo sequencing earns its place when the peptide genuinely isn’t in any database, common with novel biologics, unusual organisms, or antibody sequencing. Traditional de novo algorithms struggled with sensitivity, missing real peptides at usable precision thresholds. That’s changed meaningfully with deep learning approaches.
Spectralis, a deep-learning model for de novo peptide sequencing, reports notable sensitivity at high precision levels on benchmark spectra, a substantial jump over prior de novo methods at comparable precision thresholds, according to the model’s published results in Nature Communications. That gain matters practically: it means more unknown peptides get correctly sequenced without a corresponding flood of false positives, which is exactly the failure mode that made earlier de novo tools hard to trust for anything beyond manual spot-checks.
A working toolkit for this stage typically includes:
- Database search engines (various commercial and open-source options) for standard identification against a reference proteome.
- Deep-learning de novo tools like Spectralis for unknown-peptide sequencing where no database entry exists.
- Manual fragment calculators, in the tradition of the Hunt Lab’s tools, for validating ambiguous automated calls by hand.
- Spectral library search tools for DIA deconvolution and library-based identification.
Quantification: Label-Free, Isotopic Labels, and Isobaric Tags
Label-free quantification measures peptide abundance directly from MS1 ion intensity or from spectral counting, and its main appeal is simplicity: no extra chemistry, no extra cost, run the sample as-is. The trade-off is that comparing intensity across separate injections requires precise chromatographic alignment, since a peptide that elutes at 24.3 minutes in one run and 24.6 minutes in another needs to be correctly matched before its intensities can be compared. Retention time drift, even small drift, introduces quantification error if the alignment algorithm isn’t robust.
Isotopic labeling methods, like SILAC, metabolically incorporate heavy isotope-labeled amino acids into one sample population before mixing it with an unlabeled population, then measure the intensity ratio between heavy and light versions of the same peptide within a single MS1 scan. That in-scan comparison sidesteps the run-to-run alignment problem entirely, which is why SILAC remains a gold standard for cell-culture-based quantitative studies, though it doesn’t extend easily to tissue samples or human subjects.
Isobaric tags, like TMT, take a different route: peptides from different samples get chemically labeled with tags that have identical total mass but release different reporter ion masses upon fragmentation. That lets you multiplex many samples into a single LC-MS run and read out relative abundance from reporter ion intensities in the MS2 spectrum. The catch is co-isolation: if two peptides with similar precursor mass get selected together for fragmentation, their reporter ions mix, artificially compressing the measured ratio toward 1, a well-documented artifact called ratio compression.
Practical mitigation strategies worth building into your design:
- Use narrower precursor isolation windows to reduce co-isolation risk in isobaric tagging workflows.
- Normalize label-free intensities against total protein amount or a spiked internal standard, not just raw peak area.
- Run technical replicates for any label-free comparison where the biological effect size is expected to be small.
- Consider MS3-based quantification for TMT experiments where ratio compression is a known concern, since it isolates reporter ions from a purified fragment rather than the original precursor.
Chromatography Hygiene, QC, and Parameter Tuning That Actually Fix Problems
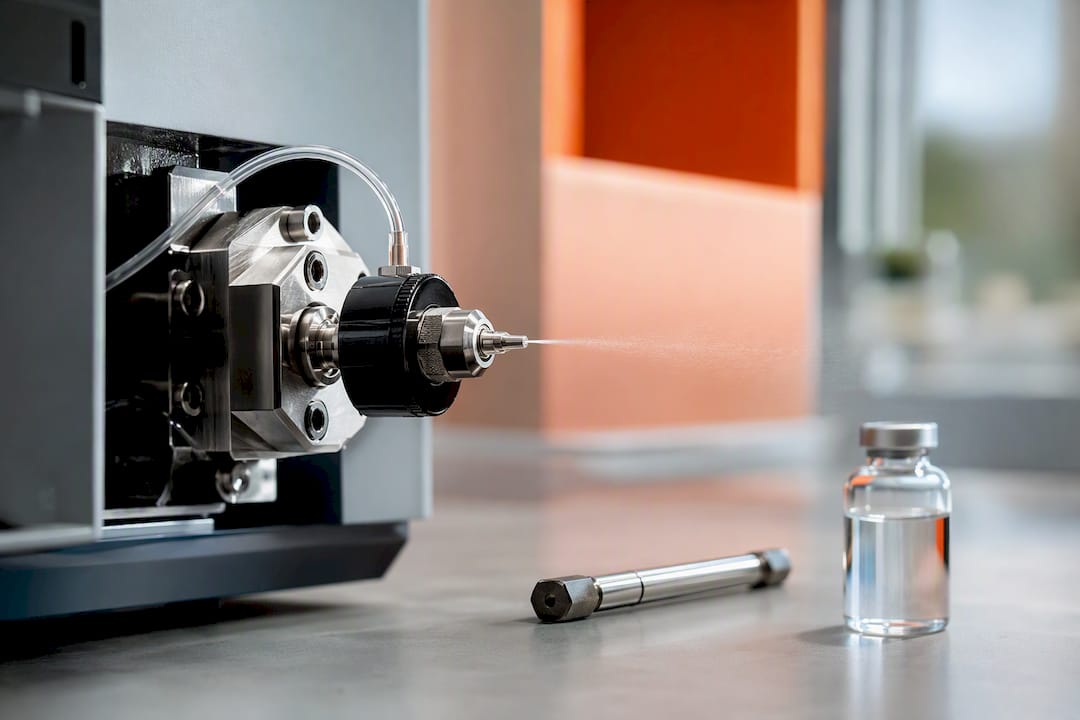
Low flow rates at the ESI emitter consistently produce better sensitivity than almost any other single adjustment you can make, and yet flow rate is one of the first things labs sacrifice when they’re trying to increase throughput. Nanoflow LC concentrates the ionizable plume, and a well-maintained emitter running at low nanoflow will outperform a poorly maintained one running at higher flow every time, regardless of how carefully you’ve tuned the mass spec settings downstream.
The base peak chromatogram, or BPC, is the fastest visual QC check available, and it should be the first thing you look at after any run. It plots the most intense ion at each retention time across the gradient, and a healthy BPC shows sharp, well-resolved peaks spread across the separation window. A flat, noisy BPC with poorly resolved humps usually points to a column problem, a contaminated sample, or ion suppression from residual detergent or salt that never got cleaned up properly.
A practical pre-run QC checklist:
- Inject a system suitability standard (a well-characterized peptide mix) before any precious sample to confirm the column and instrument are performing normally.
- Include an internal standard spiked at a known concentration to flag run-to-run variability in ionization efficiency.
- Check the BPC immediately after each run rather than waiting until the full batch finishes.
- Set precursor and product ion tolerances appropriately for your analyzer, roughly 0.02 Da for high-resolution Orbitrap data and closer to 0.5 Da for lower-resolution ion trap acquisitions, since applying Orbitrap-tight tolerances to ion trap data will throw out real matches.
Independent HPLC and mass spectrometry testing solves a problem that’s easy to overlook until it costs you a whole study: you can run the most careful method in the world, but if the peptide you started with wasn’t what the vendor claimed, none of that care matters. Verifying purity and identity before a sample ever enters your workflow is cheap compared to discovering a contamination or purity issue after weeks of data collection.
Pro Tip: Keep a running log of BPC shapes for your standard reference peptide across months, not just individual runs. A gradual broadening of peak width over weeks is usually the earliest sign of column degradation, well before it shows up as an obvious identification failure.
The Real Bottleneck in Peptide Mass Spectrometry
Here’s the uncomfortable truth about most peptide MS troubleshooting: researchers spend hours tuning MS2 fragmentation parameters when the actual problem is sitting in the LC line or the sample prep bench. We’ve made the point throughout this guide that emitter flow rate and chromatography hygiene often matter more than any software setting, and it’s worth restating as a priority, not an afterthought.
If you take three things from this guide, make them these. First, match your fragmentation method to your question, not your habit, since CID/HCD and ETD answer genuinely different questions about PTMs and larger peptides. Second, respect FDR control even when the deadline is tight, because an uncontrolled false discovery rate quietly poisons every downstream biological conclusion. Third, treat sample purity as a variable you verify, not one you assume.
Deep learning tools like Spectralis are only the beginning. Expect similar model architectures to push into single-cell proteomics over the next few years, where sample amounts are vanishingly small and every percentage point of sensitivity matters more than it ever has in bulk analysis.
Before your next run: confirm digestion completeness, check your BPC, verify your tolerances match your analyzer, and confirm your starting material is what it claims to be.
— Ross
Verify Your Peptide Samples Before You Run Them
Nothing in this guide fixes a bad starting material. If the peptide going into your digestion or your peptidomics extraction isn’t what the label says, no amount of careful MS method development will save the downstream data. Borenhealth built its platform around that exact gap: independent HPLC and mass spectrometry testing across more than 200 verified vendors, with purity results and pricing updated daily instead of buried in a one-time certificate of analysis.

If you’re sourcing a peptide like Tirzepatide or Semaglutide for a study, comparing vendor lab results before you buy tells you what independent testing actually found, not just what the seller claims. And if you already have a sample sitting on the bench and you’re not fully confident in its purity, Borenhealth’s peptide sample testing service runs the same independent HPLC and MS verification this guide walks through, on your specific material. Start with the peptide vendor ratings to see which suppliers have lab-verified purity data before your next order.
Sources
Researchers building or troubleshooting a peptide MS workflow tend to circle back to the same core resources:
- A beginner’s guide to mass spectrometry–based proteomics
- Solution digestion and protein identification (mass spec resource)
- Identifying and Measuring Endogenous Peptides through Peptidomics
- ProteoSAFe / MASSIVE workflow resources