7 Lab Checks Analysts Use to Trust an HPLC Chromatogram
An HPLC chromatogram plots detector response against time, and each peak represents a compound eluting off the column. Identify components by comparing retention time to a reference standard, confirm ambiguous peaks with a diode array or mass spectrometry detector, and quantify with peak area against a validated calibration curve. Before trusting any of it, confirm system suitability and integration settings are sound.
TL;DR:
- Accurate peak identification requires matching retention times to reference standards, confirmed with spectral data when peaks coelute or identification is borderline.
- Calibration curves should use multiple standard concentrations with high correlation coefficients above 0.995, and include blanks and QC samples in every batch.
- Integration settings like baseline mode and peak width can significantly alter results, so any manual adjustments must be documented and applied consistently to standards.
- System suitability tests must show retention time RSD below 2 percent and peak area RSD below 2 percent to ensure reliable results before analysis.
- Independent lab testing verifies vendor claims by providing raw chromatograms, integration criteria, and purity data, especially when in-house analysis conflicts with vendor assertions.
Table of Contents
- What HPLC Chromatogram Interpretation Actually Requires
- Identifying Peaks: Retention Time, Standards, and Spectral Confirmation
- Quantification Essentials: Peak Area, Calibration, and Detection Limits
- Integration Settings That Quietly Change Your Results
- Common Chromatogram Artifacts and How to Fix Them
- System Suitability Checks Before You Trust Any Result
- A Step-by-Step Checklist for Interpreting a Chromatogram
- Where Independent Lab Data Fits Into In-House Interpretation
- Isocratic vs Gradient: Why the Elution Mode Changes How You Read the Plot
- Peak Resolution: The Number That Decides Whether You Can Trust an Answer
- Peak Purity: Why a Single Sharp Peak Can Still Hide a Second Compound
- How Mobile Phase Composition Reshapes Retention and Peak Shape
- Column Temperature and Flow Rate: The Variables Analysts Undercontrol
- Overlapping Peaks: When to Separate Them Physically vs Mathematically
- What Experience Teaches That Textbooks Skip
- Verify Vendor Purity Claims With Independent Lab Data
- Sources
What HPLC Chromatogram Interpretation Actually Requires
Interpreting a chromatogram means translating a squiggly line into a defensible number: what is in the sample, and how much. The x-axis tracks retention time, usually in minutes; the y-axis tracks detector response, in absorbance units for a UV detector or counts for a mass spectrometer. Everything else on the plot is built from those two axes.
A few terms do the heavy lifting in every interpretation decision:
- Baseline: the signal recorded when nothing is eluting, which should be flat and quiet.
- Noise: small random fluctuations in that baseline that limit how small a peak you can reliably detect.
- Drift: a slow upward or downward baseline shift, often from column equilibration or a mobile phase gradient.
- Peak width and tailing factor: how sharp or smeared a peak is, which affects both resolution and area accuracy.
Retention time and peak area are the two values that identify and quantify an analyte, and a chromatogram is fundamentally a two-dimensional plot where a flat baseline signals no analyte is eluting at that moment. Get the baseline wrong and every downstream number, from purity claims to concentration, inherits that error.
Identifying Peaks: Retention Time, Standards, and Spectral Confirmation
Retention time is a fingerprint, not a certainty. Two different compounds can elute at nearly the same time under the same method, so identification always needs a comparison point, not just a number on a screen.
- Run a reference standard under the identical method, same column, mobile phase, flow rate, and temperature, and record its retention time as your reference point.
- Set a retention time window, typically a small percentage or fixed time tolerance, and accept sample peaks that fall inside it as a tentative match.
- Use an internal standard when injection-to-injection variability is a concern, since it corrects for small shifts in retention caused by column aging or temperature drift.
- Document your acceptance criteria before you run samples, not after you see a result you like, so the identification rule stays objective.
- Confirm with a photodiode array (PDA) spectrum or mass spectrometry when peaks coelute or the match is borderline, because retention time alone cannot resolve two compounds with nearly identical chromatographic behavior.
A tentative identification based on retention time alone is a hypothesis. Spectral or mass confirmation is what turns it into a reportable fact.
Quantification Essentials: Peak Area, Calibration, and Detection Limits
Peak area is the standard measurement for quantitation because it accounts for the entire population of molecules eluting, regardless of how sharp or broad the peak is. Peak height is faster to read and acceptable for narrow, well-resolved peaks in routine screening, but it becomes unreliable the moment peaks broaden, tail, or partially overlap.
Building a usable calibration curve means:
- Preparing at least five to six standard concentrations spanning the expected sample range, not just above and below one guess.
- Plotting peak area against concentration and checking the linear regression’s correlation coefficient, generally expected above 0.995 for a fit-for-purpose method.
- Choosing weighted regression when the concentration range spans more than about one order of magnitude, since unweighted models overstate accuracy at the low end.
- Running a reagent blank and quality control (QC) samples in every batch, not just during initial validation.
Statistic to remember: limit of detection (LOD) and limit of quantitation (LOQ) both depend directly on baseline noise. A noisier baseline pushes both limits higher, meaning real trace-level analytes can hide below your reporting threshold even when they are physically present in the sample.
Pro Tip: Rerun your lowest calibration standard at the start and end of a long sequence. If the area drifts more than a few percent, your LOQ claim from the morning run no longer holds by the afternoon.
Integration Settings That Quietly Change Your Results
Two analysts can load the identical raw data file into the same chromatography data system (CDS) and report different concentrations, purely because of integration settings. That is not a hypothetical. It happens constantly in real labs.
- Baseline mode determines whether the software draws a straight line under a peak or follows a curved valley, which changes area for tailing or fronting peaks.
- Slope sensitivity sets how steep a rise in signal must be before the software marks the start of a peak; too high a threshold and small peaks vanish entirely.
- Peak width parameter tells the algorithm what a “normal” peak looks like in time, and a mismatch here causes shoulders to be split or merged incorrectly.
- Area and height reject thresholds filter out peaks below a set size, which is useful for noise but dangerous if it also discards a genuine trace-level compound.
- Smoothing can improve visual clarity but also shaves real signal off sharp peaks if overapplied.
Adjusting these controls can convert an unintegrated shoulder into an accepted peak/5.08%3A_Data_Analysis), or the reverse. Any manual edit needs a documented reason, and standards should be reintegrated with the same new parameters before you trust the sample results.
Pro Tip: Never manually edit a sample’s integration without applying the identical change to its calibration standards. Comparing a manually tweaked sample peak against an auto-integrated standard peak is comparing two different measurement rules.
Common Chromatogram Artifacts and How to Fix Them
Peak shape problems and baseline issues almost always trace back to a short list of causes, and most are diagnosable without rerunning the whole method from scratch.
- Tailing peaks usually point to active sites on the column (silanol interactions), a mismatched mobile phase pH, or a column nearing the end of its life.
- Fronting peaks often mean column overload, injecting too much sample mass for the column’s capacity.
- Ghost peaks that appear even in blank injections suggest carryover, a contaminated mobile phase, or a dirty injector needle.
- Baseline drift during a gradient run is often normal UV absorbance change from the mobile phase itself, but a drift during an isocratic run usually signals column equilibration problems or a leak.
- Coelution shows up as an unusually broad or asymmetric peak that resolves into two components on a PDA spectral overlay.
Before changing anything on the method, run a blank injection, flush the system, and check the column’s usage log. If the problem persists, changing selectivity (mobile phase composition, pH, or column chemistry) or switching to an orthogonal detection method resolves what a rerun with identical conditions never will.
System Suitability Checks Before You Trust Any Result
A chromatogram can look clean and still be wrong. System suitability testing exists precisely to catch instrument or method drift before it corrupts a batch of results.
- Retention time RSD across replicate injections of a standard should typically stay under 1 to 2 percent; larger swings suggest pump, temperature, or column instability.
- Peak area RSD for six or more replicate standard injections is commonly held to a similar tight tolerance, often below 2 percent.
- Plate count (N) measures column efficiency, and a declining trend over time flags a column that needs replacing.
- Tailing factor should generally sit close to 1.0, with values much above 1.5 signaling peak shape problems that will distort quantitation.
Statistic to remember: the retention factor (k) should typically fall between 1 and 20 for a well-designed method, since values outside that range mean analytes are either eluting too close to the solvent front or taking too long to be practical. Combined with selectivity (α) between peaks, k directly governs whether two compounds will resolve cleanly or blend into one another. Save every system suitability run, its metadata, and its acceptance criteria. That record is what you pull out when a result gets questioned six months later.
A Step-by-Step Checklist for Interpreting a Chromatogram
Analysts who interpret chromatograms reliably tend to follow the same sequence every time, even for routine samples, because skipping a step is how errors slip into a final report.
- Confirm system suitability first. If retention time RSD, area RSD, plate count, or tailing factor fail, stop here and troubleshoot before analyzing anything else.
- Inspect the baseline across the full run for drift, noise spikes, or ghost peaks that suggest a contamination issue.
- Verify the integration by overlaying the software’s automatic peak marks against the raw trace; look for split peaks, merged shoulders, or missed small peaks.
- Identify peaks by comparing retention times against reference standards, confirming with spectral or mass data if there’s any doubt.
- Apply the calibration curve to convert peak area into concentration, checking that the sample response falls within the calibrated range rather than requiring extrapolation.
- Check the quality controls in the same batch to confirm the calibration was valid at the time samples were run, not just at method validation.
- Finalize the report, capturing method parameters, integration settings, system suitability results, and any manual integration edits with a stated reason.
If a QC fails or a peak identification stays ambiguous after spectral review, that’s the decision point to rerun the sample rather than force a number into a report.
Pro Tip: Keep a running method notebook that logs every manual integration edit with a timestamp and reason. When an auditor or a client asks why a number changed between two reports, that notebook answers the question in thirty seconds instead of an afternoon.
Where Independent Lab Data Fits Into In-House Interpretation
In-house chromatograms tell you what your system, your column, and your calibration produced. Independent lab reports tell you something your own instrument physically cannot: whether an outside party, running its own method, sees the same purity and identity.
That distinction matters most in vendor disputes, or when confirming a purchased peptide actually matches its labeled purity before it goes into further work. A third-party report is only as useful as what it discloses, so request the actual method details, raw chromatograms, integration parameters used, and the acceptance criteria applied, not just a summary purity percentage.
- Ask whether the reported retention times and integration settings came from a method comparable to a recognized standard, or a proprietary in-house one.
- Check whether the report includes system suitability data, not just a final chromatogram image.
- If the external method differs meaningfully from your own, reprocess the raw data under your own integration parameters before comparing numbers directly. Comparing two purity figures generated under different integration rules is comparing apples measured with different scales.
Saving raw chromatograms and metadata alongside the method file is what makes that kind of cross-comparison possible months later, instead of relying on memory or a summary spreadsheet.
Isocratic vs Gradient: Why the Elution Mode Changes How You Read the Plot
Isocratic runs hold mobile phase composition constant throughout, which means peak width tends to increase steadily for later-eluting compounds. That predictable widening is actually useful for interpretation. If a late peak looks unusually narrow compared to its neighbors, that is a red flag worth investigating, not a stroke of luck.
Gradient runs change mobile phase composition over time, typically increasing organic solvent strength to pull stronger-retained compounds off the column faster. This produces more uniform peak widths across the whole run and dramatically increases peak capacity, gradient methods offer a significantly higher peak capacity than isocratic separations. That’s why complex mixtures, including many peptide samples with closely related impurities, are almost always run on a gradient rather than isocratically.
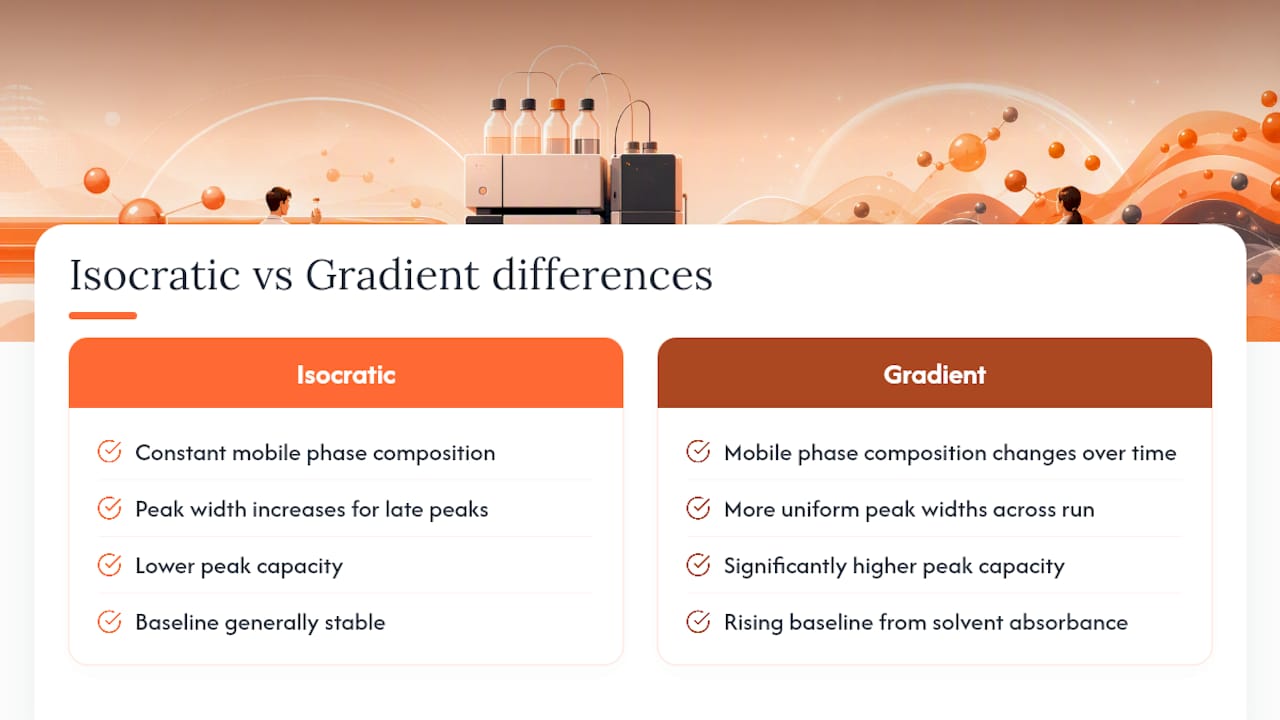
The interpretation catch with gradients is baseline behavior. A rising baseline during a gradient run is often simply the mobile phase’s own UV absorbance changing as solvent composition shifts, not necessarily contamination or drift. Confusing normal gradient baseline rise with a genuine instrument problem is a common mistake among analysts newer to gradient methods.
Gradient methods are also more sensitive to small variations in mixing accuracy and dwell volume between instruments, meaning a method transferred from one HPLC system to another can show subtly different retention times even when everything else matches. That’s one more reason retention time windows for identification need to be set with some tolerance, and why system suitability testing before a gradient run matters more, not less, than it does for a simpler isocratic separation.
Peak Resolution: The Number That Decides Whether You Can Trust an Answer
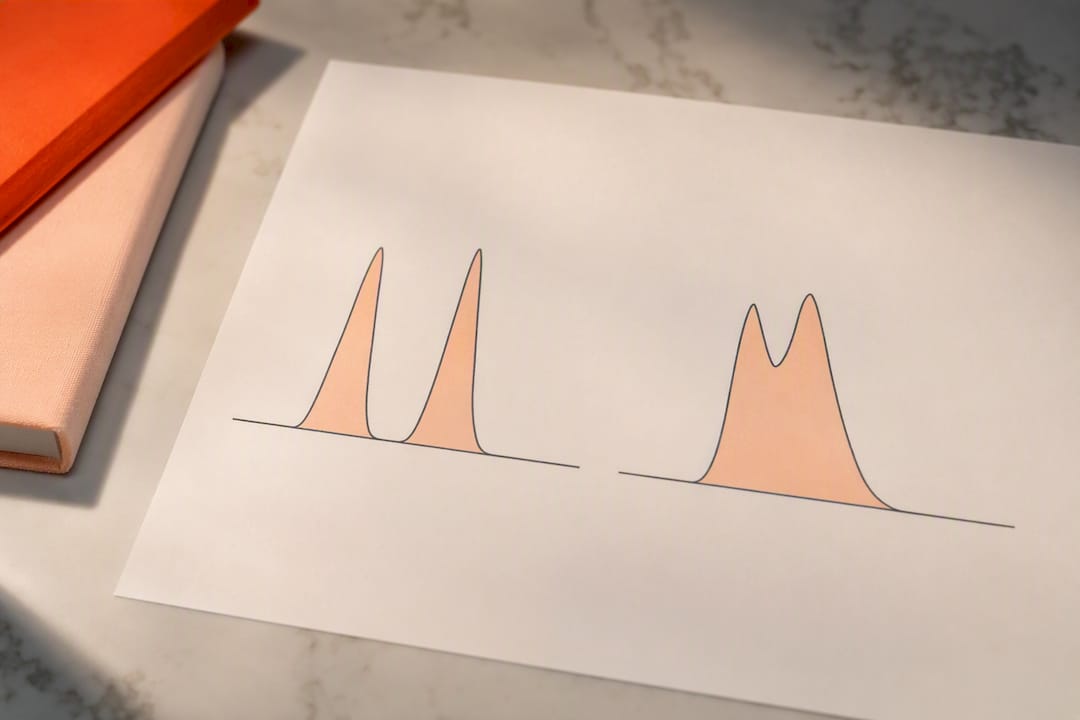
Resolution measures how cleanly two adjacent peaks separate, and it’s the single metric most responsible for whether a quantitative result is trustworthy or a guess. A resolution value above 1.5 generally means two peaks are baseline separated, meaning the software can draw a clean valley to zero between them. Below that threshold, the peaks start to merge, and any area calculation starts inheriting error from its neighbor.
Resolution depends on three things acting together: selectivity (how far apart the peaks are in retention time), efficiency (how narrow each peak is, tied to plate count), and retention (how long compounds stay on the column overall). Improving any one of the three helps, but they interact. Increasing retention factor helps resolution up to a point, then starts producing needlessly long run times with diminishing returns.
Low resolution shows up on a chromatogram as a peak with a shoulder, an unusually wide or asymmetric shape, or a valley between two peaks that doesn’t return fully to baseline. Each of those visual signs should trigger the same question: is the reported area for that peak actually one compound, or two compounds sharing one number?
The practical fix depends on the cause. If plate count is low, a longer or more efficient column, or reduced flow rate, often helps. If the peaks are close in retention time but the column is performing well, changing selectivity, adjusting mobile phase pH, switching an organic modifier, or changing column chemistry entirely, moves the peaks apart rather than just sharpening them individually. Simply increasing run time without changing selectivity rarely solves a genuine resolution problem; it just delays the same collision further down the chromatogram.
For any regulated or quality-critical measurement, resolution between critical peak pairs should be checked and documented as part of system suitability, not assumed from a single visual glance at a chromatogram that looks fine at first pass.
Peak Purity: Why a Single Sharp Peak Can Still Hide a Second Compound
A peak that looks perfectly clean on a standard UV trace can still be two coeluting compounds with nearly identical retention times and overlapping UV spectra. This is the blind spot that peak purity assessment exists to close, and it’s one of the more consequential interpretation gaps for anyone reporting purity percentages on peptides or other complex molecules.
A photodiode array (PDA) detector collects a full UV spectrum at every point across a peak, not just a single wavelength. Software then compares spectra taken at the peak’s rising edge, apex, and trailing edge. If those spectra match closely, the peak is spectrally homogeneous. If they diverge, even subtly, that’s evidence of a second, hidden component eluting at nearly the same time. PDA purity checks work well for compounds with genuinely distinct UV spectra, but they can miss impurities that happen to absorb light in a nearly identical pattern to the main compound.
Mass spectrometry closes that gap. Because MS distinguishes compounds by mass rather than by UV absorbance, it can flag a coeluting impurity even when its UV spectrum is nearly indistinguishable from the target compound’s. For anyone verifying peptide purity, where structurally similar truncation products or oxidized variants can share very similar UV behavior, MS confirmation catches problems PDA alone sometimes cannot.
The practical workflow: use PDA purity checks as a routine first screen on every significant peak, since it’s fast and doesn’t require a different detector configuration. Escalate to MS confirmation specifically when PDA purity results look borderline, when the compound class is known to produce closely related impurities, or when a purity claim will be used to make a purchasing or quality decision. Treating a single sharp peak as automatically pure, without either check, is one of the more common shortcuts that leads to overstated purity claims.
How Mobile Phase Composition Reshapes Retention and Peak Shape
Change the mobile phase, and the chromatogram changes with it, sometimes drastically. The ratio of organic solvent to aqueous buffer is the single biggest lever over retention time. More organic solvent (acetonitrile or methanol, typically) speeds elution for most reversed-phase separations; more aqueous buffer slows it down. That’s the basic mechanism behind gradient elution.
pH is the quieter variable that causes more troubleshooting headaches than solvent ratio does. For compounds with ionizable groups, acids, bases, peptides with charged side chains, small pH shifts change how much of the molecule is ionized at any given moment. An ionized molecule interacts with a reversed-phase column differently than its neutral form, which shifts retention time and can visibly change peak shape. A peak that tails badly at one pH can sharpen up considerably just a half unit away, because the ionization state becomes more uniform and consistent.
Buffer concentration and choice matter too. Too little buffering capacity, and small pH drift across a run shows up as retention time drift for ionizable analytes. The wrong buffer salt can also interact with residual silanol sites on the column, contributing to the tailing that gets blamed on “a bad column” when it’s really a mobile phase mismatch.

Ion-pairing reagents, sometimes added for very polar or charged analytes, change the whole retention mechanism rather than just tweaking it, and they can leave residual effects on a column that persist into later runs with a different mobile phase.
None of these effects show up as an error message. They show up as a chromatogram that looks slightly different from last week’s, with no obvious cause until someone checks the mobile phase composition and preparation log against what was actually used, versus what the method specifies on paper.
Column Temperature and Flow Rate: The Variables Analysts Undercontrol
Temperature and flow rate get less attention than mobile phase composition, but both quietly reshape a chromatogram in ways that catch analysts off guard.
Raising column temperature generally speeds up mass transfer between the mobile and stationary phases, which sharpens peaks and can reduce retention time slightly for most compounds. It also lowers mobile phase viscosity, which reduces backpressure, useful for methods pushing the upper pressure limits of a system. The tradeoff is that temperature changes can also shift selectivity between closely related compounds, sometimes enough to change the elution order entirely. A method that separates two peptide impurities cleanly at 30°C might show them nearly merged at 40°C, or vice versa, depending on how each compound’s retention responds to temperature.
Flow rate changes retention time in a fairly predictable, almost mechanical way: double the flow rate and retention time roughly halves, assuming everything else stays constant. But flow rate also interacts with column efficiency. Push flow too high for a given particle size and column dimension, and plate count drops, peaks broaden, and resolution between close peaks suffers even though the run finishes faster.
Both variables are also where a lot of unintentional method drift creeps in. A pump that’s slightly out of calibration delivers a flow rate a few percent off from what the method specifies, and a column oven that’s drifted a couple degrees from its setpoint, and neither shows up as an error. They show up as retention times that don’t quite match the reference standard’s expected window, or a resolution value that’s slipped below the acceptance threshold it used to clear comfortably. That’s exactly why temperature and flow rate get checked during system suitability rather than assumed from the method’s written parameters.
Overlapping Peaks: When to Separate Them Physically vs Mathematically
Two peaks that won’t resolve cleanly leave an analyst with two real options: change the chemistry so they physically separate, or use software to mathematically pull them apart after the fact. Neither is automatically the right call, and picking wrong wastes time.
Physical separation, adjusting mobile phase pH, changing an organic modifier, switching column chemistry, or slowing the gradient, is almost always the better long-term fix, because it produces genuinely independent measurements for each compound. It just takes longer: method changes need to be re-verified for system suitability, and sometimes require several rounds of adjustment before two stubborn peaks finally split.
Deconvolution is the mathematical alternative. Rather than changing the separation, software models the overlapping peak cluster as the sum of individual peaks, often assuming each one follows a Gaussian or exponentially-modified Gaussian shape, then fits parameters to estimate how much area belongs to each underlying compound. Tools built for high-throughput chromatogram processing use exactly this kind of parametric peak fitting after time-warping alignment to generate consistent peak tables across large batches of runs without manually reprocessing every single chromatogram.
Deconvolution has real limits worth respecting. It works reasonably well when the overlap is partial and the underlying peak shapes are well behaved, but it becomes unreliable when peaks overlap heavily, when their relative concentrations differ by an order of magnitude or more, or when the assumed peak shape model doesn’t match reality well. Reporting a deconvolved area as if it carries the same certainty as a fully resolved peak, without disclosing that a mathematical model was used, is a common way overlapping-peak results get overstated.
The practical rule: use deconvolution for exploratory work, batch screening, or when a genuine chemistry fix isn’t feasible in the timeframe available. For anything going into a regulated report or a purity claim that matters commercially, physical resolution through method changes is the more defensible path, even when it takes longer to get there.
What Experience Teaches That Textbooks Skip
The biggest gap between textbook chromatography and practical work isn’t knowledge, it’s discipline. Analysts who skip system suitability because “the column’s been fine for months” are the ones who eventually report a bad batch. Automatic integration deserves a skeptical eye every single run, not just when a result looks obviously wrong. A simple daily column log and periodic blank runs catch more real problems than any single piece of software. Automation speeds up chromatogram processing, but it never replaces a trained eye checking whether a peak actually makes sense.
— Ross
Verify Vendor Purity Claims With Independent Lab Data
Reading your own chromatogram carefully solves half the problem. The other half is knowing whether the peptide you bought actually matches the purity a vendor advertised, and in-house equipment can’t answer that question about someone else’s product. An independent, third-party HPLC and mass spectrometry testing service across many verified vendors, with purity data you can compare directly against what a seller claims on their listing.

If you’re settling a discrepancy between a vendor’s stated purity and what your own analysis suggests, or you simply don’t have HPLC access in-house, submitting a sample for independent testing gives you a chromatogram, integration parameters, and acceptance criteria from a lab with no stake in the vendor’s reputation. For a broader check before you buy, Borenhealth’s vendor comparison rankings show lab-verified purity scores across peptides like Tirzepatide and Semaglutide, updated with daily pricing so quality and cost sit side by side. Start by checking a vendor’s current lab-verified rating before your next purchase.
Sources
- Gradient vs isocratic elution (Danaher/lifesciences)
- The essence of modern HPLC (LCGC / Chromatography Online)
- HPLC basics (Thermo Fisher)
- What is HPLC — Shimadzu